这个简短的教程描述了如何在 Linux 上使用查看 CPU 温度 lm_sensors. Lm_sensors,简称 大号inux-米监测 传感器, 是一款免费软件,提供了监控 CPU 温度、电压、湿度和风扇所需的工具和驱动程序。 它还可以检测机箱入侵。 因此,您可以找出有缺陷的硬件组件,并更换它以避免系统挂起或过热问题。
在 Linux 上安装 lm_sensors
Lm_sensors 预装了大多数现代 Linux 操作系统。 如果尚未安装,您可以如下所示进行安装。
在 Arch Linux 及其衍生产品上:
$ sudo pacman -S lm_sensors
在 RHEL、CentOS、 Fedora:
$ sudo yum install lm_sensors
或者,
$ sudo dnf install lm_sensors
在 Debian、Ubuntu、Linux Mint 上:
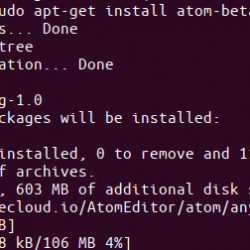
$ sudo apt-get install lm-sensors
在 SUSE 上,openSUSE:
$ sudo zypper in sensors
下载 – 免费备忘单:“Linux 命令行备忘单”
配置 Lm_sensors
安装后,运行以下命令来配置 lm_sensors:
$ sudo sensors-detect
这 传感器检测 是一个独立程序,用于检测已安装的硬件并推荐要加载的特定模块。 “安全”答案是默认值,所以只需点击 ENTER 接受默认值。 它不会引起任何问题。 这将创建 /etc/conf.d/lm_sensors 使用的配置文件 lm_sensors.service 在启动时自动加载内核模块。
我的 DELL 笔记本电脑中上述命令的示例输出:
# sensors-detect version 3.6.0 # System: Dell Inc. Inspiron N5050 [Not Specified] (laptop) # Board: Dell Inc. 01HXXJ # Kernel: 5.4.0-42-generic x86_64 # Processor: Intel(R) Core(TM) i3-2350M CPU @ 2.30GHz (6/42/7) This program will help you determine which kernel modules you need to load to use lm_sensors most effectively. It is generally safe and recommended to accept the default answers to all questions, unless you know what you're doing. Some south bridges, CPUs or memory controllers contain embedded sensors. Do you want to scan for them? This is totally safe. (YES/no): Module cpuid loaded successfully. Silicon Integrated Systems SIS5595... No VIA VT82C686 Integrated Sensors... No VIA VT8231 Integrated Sensors... No AMD K8 thermal sensors... No AMD Family 10h thermal sensors... No AMD Family 11h thermal sensors... No AMD Family 12h and 14h thermal sensors... No AMD Family 15h thermal sensors... No AMD Family 16h thermal sensors... No AMD Family 15h power sensors... No AMD Family 16h power sensors... No Intel digital thermal sensor... Success! (driver `coretemp') Intel AMB FB-DIMM thermal sensor... No Intel 5500/5520/X58 thermal sensor... No VIA C7 thermal sensor... No VIA Nano thermal sensor... No Some Super I/O chips contain embedded sensors. We have to write to standard I/O ports to probe them. This is usually safe. Do you want to scan for Super I/O sensors? (YES/no): Probing for Super-I/O at 0x2e/0x2f Trying family `National Semiconductor/ITE'... No Trying family `SMSC'... No Trying family `VIA/Winbond/Nuvoton/Fintek'... No Trying family `ITE'... No Probing for Super-I/O at 0x4e/0x4f Trying family `National Semiconductor/ITE'... Yes Found unknown chip with ID 0xfc11 Some hardware monitoring chips are accessible through the ISA I/O ports. We have to write to arbitrary I/O ports to probe them. This is usually safe though. Yes, you do have ISA I/O ports even if you do not have any ISA slots! Do you want to scan the ISA I/O ports? (YES/no): Probing for `National Semiconductor LM78' at 0x290... No Probing for `National Semiconductor LM79' at 0x290... No Probing for `Winbond W83781D' at 0x290... No Probing for `Winbond W83782D' at 0x290... No Lastly, we can probe the I2C/SMBus adapters for connected hardware monitoring devices. This is the most risky part, and while it works reasonably well on most systems, it has been reported to cause trouble on some systems. Do you want to probe the I2C/SMBus adapters now? (YES/no): Using driver `i2c-i801' for device 0000:00:1f.3: Intel Cougar Point (PCH) Module i2c-dev loaded successfully. Next adapter: SMBus I801 adapter at f040 (i2c-0) Do you want to scan it? (YES/no/selectively): Client found at address 0x50 Probing for `Analog Devices ADM1033'... No Probing for `Analog Devices ADM1034'... No Probing for `SPD EEPROM'... Yes (confidence 8, not a hardware monitoring chip) Probing for `EDID EEPROM'... No Next adapter: i915 gmbus ssc (i2c-1) Do you want to scan it? (yes/NO/selectively): Next adapter: i915 gmbus vga (i2c-2) Do you want to scan it? (yes/NO/selectively): Next adapter: i915 gmbus panel (i2c-3) Do you want to scan it? (yes/NO/selectively): Next adapter: i915 gmbus dpc (i2c-4) Do you want to scan it? (yes/NO/selectively): Next adapter: i915 gmbus dpb (i2c-5) Do you want to scan it? (yes/NO/selectively): Next adapter: i915 gmbus dpd (i2c-6) Do you want to scan it? (yes/NO/selectively): Next adapter: DPDDC-B (i2c-7) Do you want to scan it? (yes/NO/selectively): Now follows a summary of the probes I have just done. Just press ENTER to continue: Driver `coretemp': * Chip `Intel digital thermal sensor' (confidence: 9) Do you want to overwrite /etc/conf.d/lm_sensors? (YES/no): Unloading i2c-dev... OK Unloading cpuid... OK
完毕! 让我们继续看看如何使用查找 CPU 温度。
在 Linux 上使用 lm_sensors 查看 CPU 温度
键入以下命令以查看您的 Linux 机器的 CPU 温度信息:
$ sensors
样本输出:
coretemp-isa-0000 Adapter: ISA adapter Package id 0: +57.0°C (high = +80.0°C, crit = +85.0°C) Core 0: +57.0°C (high = +80.0°C, crit = +85.0°C) Core 1: +54.0°C (high = +80.0°C, crit = +85.0°C) BAT0-acpi-0 Adapter: ACPI interface in0: 12.43 V curr1: 1000.00 uA dell_smm-virtual-0 Adapter: Virtual device Processor Fan: 3449 RPM CPU: +57.0°C Other: +52.0°C Other: +51.0°C GPU: +16.0°C Other: +55.0°C acpitz-acpi-0 Adapter: ACPI interface temp1: +57.5°C (crit = +84.0°C)
使用 Lm_sensors 在 Linux 上查看 CPU 温度
正如您在上面的输出中看到的,lm_sensors 在括号中显示了我的 CPU 的当前温度、高温和临界温度。 如果您发现任何硬件设备达到高温或临界温度,您可能需要检查该硬件设备。
默认情况下,Lm_sensors 以摄氏度显示温度。
显示温度 华氏度 而不是摄氏度,使用 -F 选项。
$ sensors -f
样本输出:
coretemp-isa-0000 Adapter: ISA adapter Package id 0: +131.0°F (high = +176.0°F, crit = +185.0°F) Core 0: +131.0°F (high = +176.0°F, crit = +185.0°F) Core 1: +123.8°F (high = +176.0°F, crit = +185.0°F) BAT0-acpi-0 Adapter: ACPI interface in0: 12.43 V curr1: 1000.00 uA dell_smm-virtual-0 Adapter: Virtual device Processor Fan: 3510 RPM CPU: +127.4°F Other: +120.2°F Other: +120.2°F GPU: +60.8°F Other: +123.8°F acpitz-acpi-0 Adapter: ACPI interface temp1: +128.3°F (crit = +183.2°F)
要实时监控 CPU 温度,您可以使用 ‘手表’ 命令如下。
$ watch sensors
样本输出: